Phenology is the study of the timing of the specific life history events of a species, particularly in relation to cyclic seasonal variations [1,2,3]. This timing is an important factor in plant reproductive cycles and hence important to the population dynamics and persistence of a species [1,2]. It is also linked to the life history patterns of species that feed on these species as well as their interactions with each other [1,4]. Phenology is known to be linked with environmental variables such as temperature and precipitation [5,6,7,8]. In the same species, different phenological patterns can arise based on differences in environmental factors in which it occurs. For example, the same species may show earlier leaf shedding at higher altitudes [9].
I did a project for SeasonWatch where I explored the effect of latitude on the flowering phenology of the wide-ranging tree species Cassia fistula by analysing photographs of this species shared on social media and citizen science portals. I chose C. fistula for this project as it has a wide geographical range, and is native to the Indian subcontinent. I was further motivated to choose C. fistula as it is a species with large cultural significance [10,11] , and therefore more likely to be documented. India has a very wide variation in latitudes and the climate varies accordingly – with very little temperature seasonality in the south and high temperature seasonality in the north, west and eastern regions of the country. One can therefore expect that the period when temperatures are optimal for flowering occurs later in the year and for less time in higher latitudes. I hypothesised that as the latitude increased, C. fistula would start to flower later in the year and over a smaller period of time. This should also reflect in images of the species uploaded on public media repositories – with images of flowering trees being documented from southern latitudes much before the northern latitudes.

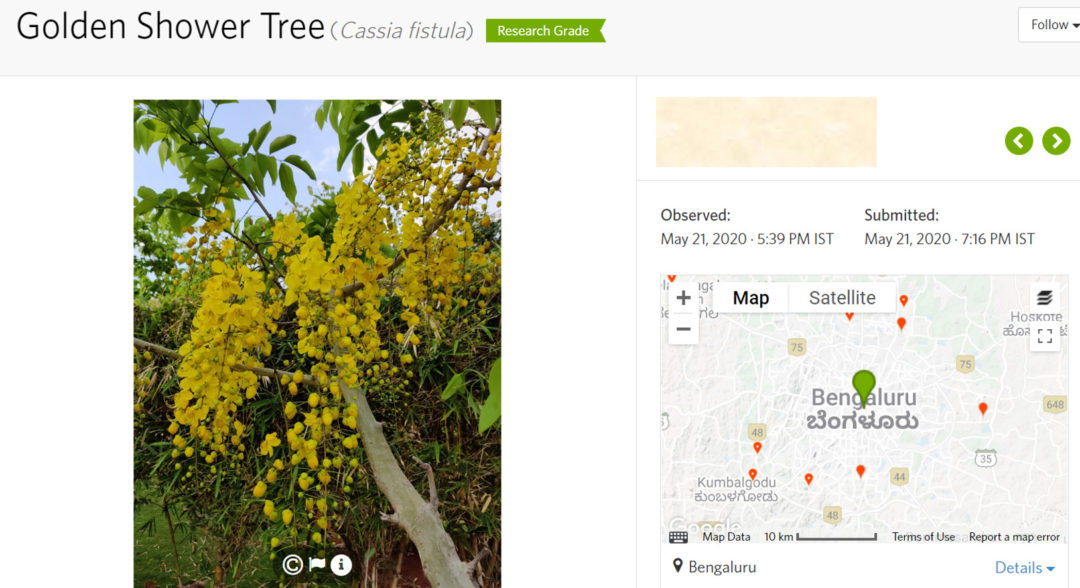
An example of a photo used for the project
To find flowering tree images, I trawled through Facebook, Flickr and Instagram which allow users to upload photographs with a date and location for the image. I also looked at two online databases for logging biodiversity: iNaturalist and India Biodiversity Portal. These databases also require contributors to report the location and date of observation for the images. I extracted images from social media websites by using the website’s inbuilt search as well as using hashtags to look up Cassia fistula using its scientific name and its name in every major Indian language including English. I then sorted through all the posts under these searches. I considered only those posts that explicitly mentioned the date in the caption that also had a geotag or mentioned location to ensure accuracy of the flowering date and tree location. I identified different phenological stages (leaves, flowers and fruits) using the photographs, and recorded metadata like – geographical coordinates, date of observation, date of post, and data source. I then chose the images that showed the presence of buds and open flowers and analysed these images to find the relationship between time of flowering and latitude.
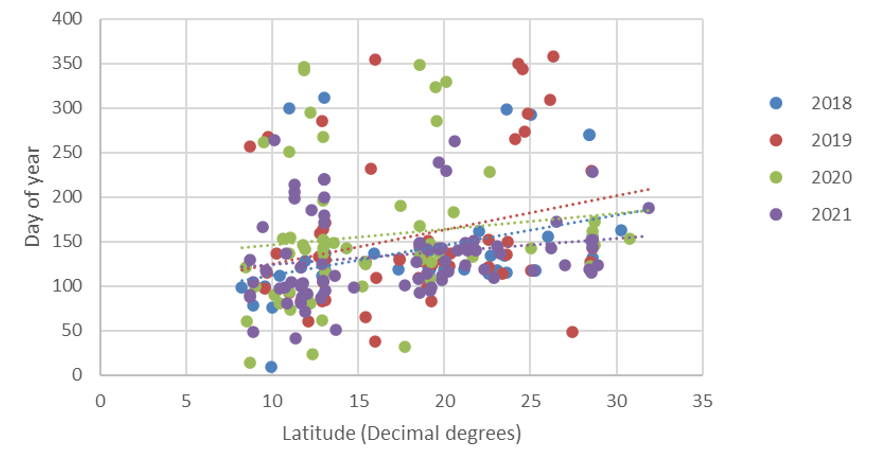
I found 247 usable images for a period of three and a half years from January 2018 to November 2021. I plotted the day on which the image was taken against the latitude at which the image was taken and this is what I found:

Latitude v/s day on which an image of flowering Cassia fistula was taken.
Images were posted on social media and citizen science portals almost throughout the year, but most images of flowering C. fistula trees across 3.5 years seem to be between the 50th and 200th day of the year (i.e. between end-February and July). I added a linear trend-line for each of the years, and these trendlines indicate that the images for the higher latitudes appear later in the year than for the lower latitudes.
I concluded that, based on the images shared in public repositories, C. fistula could be flowering later in the year and for shorter time at higher latitudes. Could the pattern in the images be a reflection of the temperature seasonality across latitudes? A well-rounded scientific study would supplement these images with other kinds of data – like long-term observation of the same trees across different latitudes – to verify if these images in fact reflect the true latitudinal patterns of flowering. I think that data from this project can be used as a start to create baseline data on the phenology of C.fistula. Used in tandem with data on other tree species it can also be used to predict how certain tree communities and hence ecosystems may respond to these changes.
If Cassia fistula does have a temperature threshold that triggers flowering then I would expect flowering season to increase in duration across latitudes over the next few years as global temperatures increase [12]. In recent years, due to climate change, seasonal climatic variations have begun to differ from their normal patterns [12]. This could cause variations in the flowering dates [6,13] and reproductive cycles of many tree species which could in turn affect a whole host of animal species that depend on these trees to provide food and habitats. Thus knowledge of the phenology of a species is important as it can be used to predict how the species may respond to climate change and the larger implications of this at an ecosystem level.
References
- Rathcke, B. and Lacey, E.P., 1985. Phenological patterns of terrestrial plants. Annual review of ecology and systematics, 16(1), pp.179-214.
- Fenner, M., 1998. The phenology of growth and reproduction in plants. Perspectives in Plant Ecology, Evolution and Systematics, 1(1), pp.78-91.
- Lieth, H., 1974. Purposes of a phenology book. In Phenology and seasonality modeling (pp. 3-19). Springer, Berlin, Heidelberg.
- Crawley, M.J. and Akhteruzzaman, M., 1988. Individual variation in the phenology of oak trees and its consequences for herbivorous insects. Functional Ecology, pp.409-415.
- Saxe, H., Cannell, M.G., Johnsen, Ø., Ryan, M.G. and Vourlitis, G., 2001. Tree and forest functioning in response to global warming. New phytologist, 149(3), pp.369-399.
- Badeck, F.W., Bondeau, A., Böttcher, K., Doktor, D., Lucht, W., Schaber, J. and Sitch, S., 2004. Responses of spring phenology to climate change. New phytologist, 162(2), pp.295-309. And references therein.
- Hayden, B., Greene, D.F. and Quesada, M., 2010. A field experiment to determine the effect of dry-season precipitation on annual ring formation and leaf phenology in a seasonally dry tropical forest. Journal of Tropical Ecology, 26(2), pp.237-242.
- Günter, S., Stimm, B., Cabrera, M., Diaz, M.L., Lojan, M., Ordonez, E., Richter, M. and Weber, M., 2008. Tree phenology in montane forests of southern Ecuador can be explained by precipitation, radiation and photoperiodic control. Journal of Tropical Ecology, 24(3), pp.247-258.
- Vitasse, Y., Delzon, S., Bresson, C.C., Michalet, R. and Kremer, A., 2009. Altitudinal differentiation in growth and phenology among populations of temperate-zone tree species growing in a common garden. Canadian Journal of Forest Research, 39(7), pp.1259-1269.
- Cassia fistula – Wikipedia
- Danish, M., Singh, P., Mishra, G., Srivastava, S., Jha, K.K. and Khosa, R.L., 2011. Cassia fistula Linn.(Amulthus)-An important medicinal plant: A review of its traditional uses, phytochemistry and pharmacological properties. J Nat Prod Plant Resour, 1(1), pp.101-118.
- IPCC, 2021: Climate Change 2021: The Physical Science Basis. Contribution of Working Group I to the Sixth Assessment Report of the Intergovernmental Panel on Climate Change [Masson-Delmotte, V., P. Zhai, A. Pirani, S.L. Connors, C. Péan, S. Berger, N. Caud, Y. Chen, L. Goldfarb, M.I. Gomis, M. Huang, K. Leitzell, E. Lonnoy, J.B.R. Matthews, T.K. Maycock, T. Waterfield, O. Yelekçi, R. Yu, and B. Zhou (eds.)]. Cambridge University Press. In Press.
- Bertin, R.I., 2008. Plant phenology and distribution in relation to recent climate change. The Journal of the Torrey Botanical Society, 135(1), pp.126-146.
About the author: Sidharth Mahesh is a recent twelfth standard science graduate from Poorna Learning Center, Bangalore. He developed a strong passion for nature and wildlife at a young age through numerous visits to wildlife sanctuaries with his parents, where he also helped them collect data for their research on forest and savanna ecology. He has also volunteered with marine researchers in the Andaman and Nicobar islands, monitoring dugongs. He likes traveling and being outdoors and hopes to pursue a career in ecology or conservation.


